WinLine BI
Report Management
Our WinLine BI tools support you in gathering, preparing and displaying your company data. Use BI for systematic analysis of data from many areas of the WinLine ERP suite, e.g., order entry/invoicing, accounting, cost accounting, asset management, project management, HR, and data contained in user-defined lists. BI reports give you information for making strategic business decisions in a timely manner.
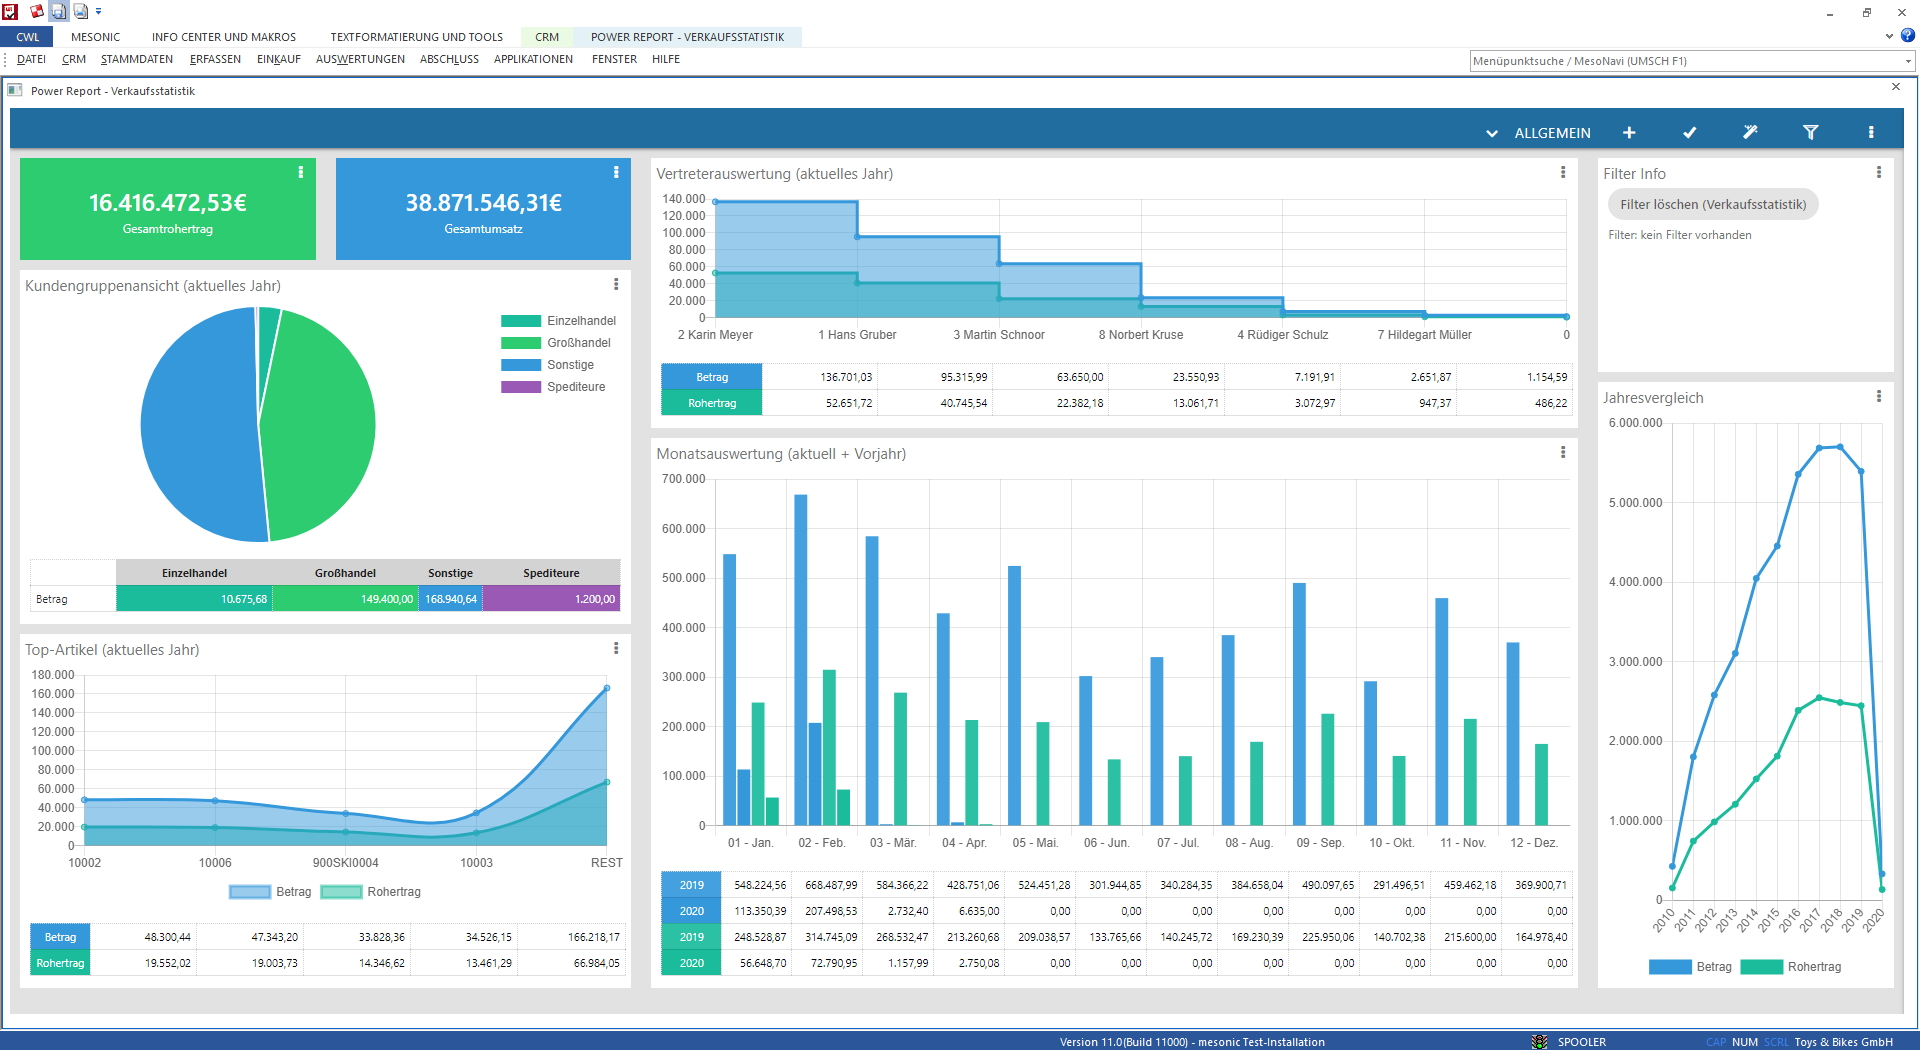
The integrated Data Assistent guides you through step-by-step when setting up reports containing large amounts of data. BI reports can be easily and attractively displayed with WinLine Power Report in a WinLine Cockpit.
Example WinLine Power Report

Areas of Application
- Sales and marketing analysis
- Finance management and controlling
- Budgeting and planning
- Price calculation
- Profitability analysis
- Quality control
- Project controlling
- Employee cost control
BI Module Variants
WinLine BI offers countless analysis and visualisation options for your company data. Choose your preferred module variant between the two versions WinLine BI BUSINESS and WinLine BI CORPORATE.
| Function | BI BUSINESS | BI CORPORATE |
|---|---|---|
| Reports on sales turnover, documents, and sales reps | ✓ | ✓ |
|
Reports on accounting posting journal data |
✓ | ✓ |
| Reports on cost types, cost centers, and cost objectives | ✓ | ✓ |
| Reports on budgets (Target/Actual) | ✓ | ✓ |
| Reports on fixed assets | ✓ | ✓ |
| Reports on project data (documents and budgets) | ✓ | ✓ |
| Reports on employee costs | ✓ | ✓ |
| Reports on user-defined lists from the WinLine LIST module | ✓ | ✓ |
| Numerous graphical display modes (with Power Report) | ✓ | ✓ |
| Insertion of Power Report widgets in Cockpits | ✓ | ✓ |
| Online Data access (WinLine MULTI) | ✓ | ✓ |
| Annotations: individualized flagging properties in BI reports (remarks, status icon, etc.) | ✓ | ✓ |
| Data Source Management | ✓ | ✓ |
| Reporting across multiple databases | ✓ | |
| Import and Export of data sources | ✓ | |
| Extra filter selection options | ✓ | |
| Automated updating of data sources | ✓ | |
| Automated updating of Power Report Widgets in the Cockpit | ✓ | |
| WinLine ACTION SERVER for periodic report generation/updating | ✓ | |
| Automatic Alerts | ✓ | |
| Status Icons - color-coding by defined threshold limits in report | ✓ | |
| Aggregation of multiple columns to one column (bracketing) | ✓ | |
| Customized report design | ✓ | |
| In-House Reporting | Add-on | |
| Graphical display of linked WinLine objects | Add-on |
